library(here)
library(readxl)
library(dplyr)
library(janitor)
library(tidyr)
library(ggplot2)PGP - Candidate locations selection
The brief
The RSA is applying for funding to run a Playful Green Planet (PGP) pilot in one or two locations in the UK. Ideal locations for a pilot will be places that are experiencing high levels of deprivation and have low access to green spaces. PGP locations will be a collaboration between the RSA, our partners and the local community where the pilots will run. A PGP Stewart (most likely an RSA Fellow) will be pivotal for establishing a connection with place. As such, we are looking for 5-10 cities across at least 2 countries in the UK to open up a call for Stewards.
What is a city?
The first thing to establish is the type of area we will be targetting. A practical answer to the complicated question of how to define a city comes from the Centre for Cities. They have selected the UK’s 63 largest cities and towns, which they have defined as Primary Urban Areas (PUAs). As explained on their website:
This is a measure of the “built-up” area of a large city or town, rather than individual local authority districts. We use PUAs in our analysis because they provide a consistent measure to compare concentrations of economic activity across the UK. This makes them distinct from city region or combined authority geographies.
This report adopts the methodology of the Centre for Cities and limits itself to the 63 PUAs. Clearly, this excludes rural areas. This should not be a problem for the purposes of PGP, as rural areas are likely to have better access to green spaces. On the other hand, these green spaces may not be suitable for children to play in. Rural places could also suffer from high levels of deprivation. The question of whether rural areas should be excluded from consideration for PGP projects should be considered; however, for the purposes of this pilot restricting consideration to urban areas can be justified.
Another limitation of this approach is that the vast majority of the 63 PUAs is located in England:
- 1 PUA in Northern Ireland (Belfast)
- 3 PUAs in Wales (Cardiff, Newport, Swansea)
- 4 PUAs in Scotland (Aberdeen, Dundee, Edinburgh, Glasgow)
- 55 PUAs in England
Place selection
The primary considerations in selecting candidate PGP locations are: 1. high levels of deprivation, as measured by the Index of Multiple Deprivation and, where applicable, the Income Affecting Children Index 2. access to green spaces.
Index of Multiple Deprivation & Access to Nature
The data presented below, Access to gardens and public green space in Great Britain, comes from the ONS website and contains information on both deprivation and access to nature.
The data explored here relates to green space that is a public park, a public garden, or a playing field (public or private). There is also data available on private gardens, but there was not sufficient time to explore that data.
The spreadsheet on public parks, public gardens, and playing fields contains the following sheets:
excel_sheets(here("data-raw", "ospublicgreenspacereferencetables.xlsx")) [1] "Readme" "Country Parks only"
[3] "Country Parks and Playing Field" "Region Parks only"
[5] "Region Parks and Playing Fields" "LAD Parks only"
[7] "LAD Parks and Playing Fields" "LSOA Parks only"
[9] "LSOA Parks and Playing Fields" "GB Access by Ethnicity" To answer the question we’re interested in (“Which are the most deprived cities in the UK?”) we need to:
- combine Local Authority Districts (LADs) into Primary Urban Areas (PUAs)
- calculate the level of deprivation in each PUA, taking into account that deprivation is measured on the level of LSOAs (Lower layer Super Output Areas)
- order PUAs in order of deprivation
Let’s start by looking at the data in sheet number nine, LSOA Parks and Playing Fields. This is a sensible starting point because 1) it has the more expansive definition of green space and 2) the LSOA level is where the deprivation data is included.
Index of Multiple Deprivation
lsoa_parks_play <- read_excel(here("data-raw", "ospublicgreenspacereferencetables.xlsx"),
                              sheet = 9) %>%
  clean_names() %>%
  drop_na(country_code)

lsoa_parks_play_dim <- dim(lsoa_parks_play)
lsoa_parks_play_names <- names(lsoa_parks_play)
The dataset contains information on 41396 LSOAs in England, Scotland, and Wales. Note that no information on Northern Ireland is contained in this dataset.
The next step is to combine LADs (and their component LSOAs) into PUAs. This is done using the Centre for Cities 2022 Table. The code doing this is hidden because it is very long, but essentially what it does is create a new variable called PUA and assigns a value to it depending on the LAD name associated with each observation.
Code
puas <- lsoa_parks_play %>%
  mutate(PUA = case_when(
    # the CfC table had this LAD down as Aberdeen. ideally check if Aberdeen City is what is meant, as there is also Aberdeenshire
           lad_name == "Aberdeen City" ~ "Aberdeen",
           lad_name == "Rusmoor" ~ "Aldershot",
           lad_name == "Surrey Heath" ~ "Aldershot",
           lad_name == "Barnsley" ~ "Barnsley",
           lad_name == "Basildon" ~ "Basildon",
           lad_name == "Wirral" ~ "Birkenhead",
           lad_name == "Birmingham" ~ "Birmingham",
           lad_name == "Dudley" ~ "Birmingham",
           lad_name == "Sandwell" ~ "Birmingham",
           lad_name == "Solihull" ~ "Birmingham",
           lad_name == "Walsall" ~ "Birmingham",
           lad_name == "Wolverhampton" ~ "Birmingham",
           lad_name == "Blackburn with Darwen" ~ "Blackburn",
           lad_name == "Blackpool" ~ "Blackpool",
           lad_name == "Fylde" ~ "Blackpool",
           lad_name == "Dorset" ~ "Bournemouth",
           lad_name == "Bournemouth, Christchurch and Poole" ~ "Bournemouth",
           lad_name == "Bradford" ~ "Bradford",
           lad_name == "Adur" ~ "Brighton",
           lad_name == "Brighton and Hove" ~ "Brighton",
           lad_name == "City of Bristol" ~ "Bristol",
           lad_name == "South Gloucestershire" ~ "Bristol",
           lad_name == "Burnley" ~ "Burnley",
           lad_name == "Pendle" ~ "Burnley",
           lad_name == "Cambridge" ~ "Cambridge",
           lad_name == "Cardiff" ~ "Cardiff",
           lad_name == "Medway" ~ "Chatham",
           lad_name == "Coventry" ~ "Coventry",
           lad_name == "Crawley" ~ "Crawley",
           lad_name == "Derby" ~ "Derby",
           lad_name == "Doncaster" ~ "Doncaster",
           # the CfC table had this LAD down as Dundee
           lad_name == "Dundee City" ~ "Dundee",
           # the CfC table had this LAD down as Edinburgh
           lad_name == "City of Edinburgh" ~ "Edinburgh",
           lad_name == "Exeter" ~ "Exeter",
           lad_name == "East Dunbartonshire" ~ "Glasgow",
           lad_name == "East Renfrewshire" ~ "Glasgow",
           lad_name == "Glasgow" ~ "Glasgow",
           lad_name == "Renfrewshire" ~ "Glasgow",
           lad_name == "Gloucester" ~ "Gloucester",
           lad_name == "Kirklees" ~ "Huddersfield",
           # the CfC table had this LAD down as Kingston upon Hull
           lad_name == "Kingston upon Hull, City of" ~ "Hull",
           lad_name == "Ipswich" ~ "Ipswich",
           lad_name == "Leeds" ~ "Leeds",
           lad_name == "Blaby" ~ "Leicester",
           lad_name == "Leicester" ~ "Leicester",
           lad_name == "Oadby and Wigston" ~ "Leicester",
           lad_name == "Knowsley" ~ "Liverpool",
           lad_name == "Barking and Dagenham" ~ "London",
           lad_name == "Barnet" ~ "London",
           lad_name == "Bexley" ~ "London",
           lad_name == "Brent" ~ "London",
           lad_name == "Bromley" ~ "London",
           lad_name == "Broxbourne" ~ "London",
           lad_name == "Camden" ~ "London",
           lad_name == "City of London" ~ "London",
           lad_name == "Croydon" ~ "London",
           lad_name == "Dartford" ~ "London",
           lad_name == "Ealing" ~ "London",
           lad_name == "Elmbridge" ~ "London",
           lad_name == "Enfield" ~ "London",
           lad_name == "Epping Forest" ~ "London",
           lad_name == "Epsom and Ewell" ~ "London",
           lad_name == "Gravesham" ~ "London",
           lad_name == "Greenwich" ~ "London",
           lad_name == "Hackney" ~ "London",
           lad_name == "Hammersmith and Fulham" ~ "London",
           lad_name == "Haringey" ~ "London",
           lad_name == "Harrow" ~ "London",
           lad_name == "Havering" ~ "London",
           lad_name == "Hertsmere" ~ "London",
           lad_name == "Hillingdon" ~ "London",
           lad_name == "Hounslow" ~ "London",
           lad_name == "Islington" ~ "London",
           lad_name == "Kensington and Chelsea" ~ "London",
           lad_name == "Kingston upon Thames" ~ "London",
           lad_name == "Lambeth" ~ "London",
           lad_name == "Lewisham" ~ "London",
           lad_name == "Merton" ~ "London",
           lad_name == "Newham" ~ "London",
           lad_name == "Redbridge" ~ "London",
           lad_name == "Richard upon Thames" ~ "London",
           lad_name == "Runnymede" ~ "London",
           lad_name == "Southwark" ~ "London",
           lad_name == "Spelthorne" ~ "London",
           lad_name == "Sutton" ~ "London",
           lad_name == "Three Rivers" ~ "London",
           lad_name == "Tower Hamlets" ~ "London",
           lad_name == "Waltham Forest" ~ "London",
           lad_name == "Wandsworth" ~ "London",
           lad_name == "Watford" ~ "London",
           lad_name == "Westminster" ~ "London",
           lad_name == "Woking" ~ "London",
           lad_name == "Luton" ~ "Luton",
           lad_name == "Bolton" ~ "Manchester",
           lad_name == "Bury" ~ "Manchester",
           lad_name == "Manchester" ~ "Manchester",
           lad_name == "Oldham" ~ "Manchester",
           lad_name == "Rochdale" ~ "Manchester",
           lad_name == "Salford" ~ "Manchester",
           lad_name == "Stockport" ~ "Manchester",
           lad_name == "Tameside" ~ "Manchester",
           lad_name == "Trafford" ~ "Manchester",
           lad_name == "Ashfield" ~ "Mansfield",
           lad_name == "Mansfield" ~ "Mansfield",
           lad_name == "Middlesbrough" ~ "Middlesbrough",
           lad_name == "Redcar and Cleveland" ~ "Middlesbrough",
           lad_name == "Stockton-on-Tees" ~ "Middlesbrough",
           lad_name == "Milton Keynes" ~ "Milton Keynes",
           lad_name == "Gateshead" ~ "Newcastle",
           lad_name == "Newcastle upon Tyne" ~ "Newcastle",
           lad_name == "North Tyneside" ~ "Newcastle",
           lad_name == "South Tyneside" ~ "Newcastle",
           lad_name == "Newport" ~ "Newport",
           lad_name == "Torfaen" ~ "Newport",
           # the CfC table only lists the LAD of West Northamptonshire
           # this does not exist in the data
           # only East Northamptonshire and Northampton exist
           # this warrants further investigation
           lad_name == "Northampton" ~ "Northampton",
           lad_name == "Broadland" ~ "Norwich",
           lad_name == "Norwich" ~ "Norwich",
           lad_name == "Broxtowe" ~ "Nottingham",
           lad_name == "Erewash" ~ "Nottingham",
           lad_name == "Gedling" ~ "Nottingham",
           lad_name == "Nottingham" ~ "Nottingham",
           lad_name == "Oxford" ~ "Oxford",
           lad_name == "Peterborough" ~ "Peterborough",
           lad_name == "Plymouth" ~ "Plymouth",
           lad_name == "Portsmouth" ~ "Portsmouth",
           lad_name == "Fareham" ~ "Portsmouth",
           lad_name == "Gosport" ~ "Portsmouth",
           lad_name == "Havant" ~ "Portsmouth",
           lad_name == "Chorley" ~ "Preston",
           lad_name == "Preston" ~ "Preston",
           lad_name == "South Ribble" ~ "Preston",
           lad_name == "Reading" ~ "Reading",
           lad_name == "Wokingham" ~ "Reading",
           lad_name == "Rotherham" ~ "Sheffield",
           lad_name == "Sheffield" ~ "Sheffield",
           lad_name == "Slough" ~ "Slough",
           lad_name == "Eastleigh" ~ "Southampton",
           lad_name == "Southampton" ~ "Southampton",
           lad_name == "Castlepoint" ~ "Southend",
           lad_name == "Southend-on-Sea" ~ "Southend",
           lad_name == "Rochford" ~ "Southend",
           lad_name == "Newcastle-under-Lyme" ~ "Stoke",
           lad_name == "Stoke-on-Trent" ~ "Stoke",
           lad_name == "Sunderland" ~ "Sunderland",
           lad_name == "Neath Port Talbot" ~ "Swansea",
           lad_name == "Swansea" ~ "Swansea",
           lad_name == "Swindon" ~ "Swindon",
           lad_name == "Telford and Wrekin" ~ "Telford",
           lad_name == "Wakefield" ~ "Wakefield",
           lad_name == "Warrington" ~ "Warrington",
           lad_name == "Wigan" ~ "Wigan",
           lad_name == "Worthing" ~ "Worthing",
           lad_name == "York" ~ "York"
          ))
As mentioned previously, PUAs are defined as the largest cities and towns in the UK. As such, there are LSOAs in rural areas that do not belong to any of the PUAs. These are dropped here.
puas <- puas %>%
  drop_na(PUA)
Following procedure used in the RSA’s UK Urban Futures Commission report, relative deprivation for each PUA is determined by the percentage of LSOAs that are in the most deprived deciles.
pua_imd <- puas %>%
  count(country_name, PUA, index_of_multiple_deprivation_decile_country_specific) %>%
  group_by(country_name, PUA) %>%
  mutate(percentage = (n/sum(n)) * 100) %>%
  ungroup() %>%
  filter(index_of_multiple_deprivation_decile_country_specific %in% 1:2) %>%
  drop_na(PUA)
These PUAs are then displayed for each country in Great Britain.
England:
pua_imd %>%
  filter(country_name == "England") %>%
  rename(imd_decile = index_of_multiple_deprivation_decile_country_specific) %>%
  arrange(imd_decile, desc(percentage)) %>%
  select(-n) %>%
knitr::kable()| country_name | PUA | imd_decile | percentage |
|---|---|---|---|
| England | Liverpool | 1 | 46.9387755 |
| England | Hull | 1 | 45.1807229 |
| England | Blackburn | 1 | 36.6666667 |
| England | Burnley | 1 | 35.0427350 |
| England | Bradford | 1 | 33.5483871 |
| England | Middlesbrough | 1 | 30.2721088 |
| England | Blackpool | 1 | 28.2758621 |
| England | Birmingham | 1 | 28.0134680 |
| England | Birkenhead | 1 | 25.2427184 |
| England | Manchester | 1 | 24.2362525 |
| England | Doncaster | 1 | 23.7113402 |
| England | Leeds | 1 | 23.6514523 |
| England | Sheffield | 1 | 23.0468750 |
| England | Sunderland | 1 | 22.7027027 |
| England | Stoke | 1 | 22.1757322 |
| England | Barnsley | 1 | 21.7687075 |
| England | Newcastle | 1 | 19.2883895 |
| England | Plymouth | 1 | 17.3913043 |
| England | Telford | 1 | 16.8224299 |
| England | Wigan | 1 | 16.5000000 |
| England | Derby | 1 | 15.8940397 |
| England | Wakefield | 1 | 15.7894737 |
| England | Mansfield | 1 | 15.6028369 |
| England | Nottingham | 1 | 15.1364764 |
| England | Coventry | 1 | 14.3589744 |
| England | Peterborough | 1 | 14.2857143 |
| England | Ipswich | 1 | 14.1176471 |
| England | Leicester | 1 | 13.5416667 |
| England | Huddersfield | 1 | 12.0155039 |
| England | Gloucester | 1 | 11.5384615 |
| England | Basildon | 1 | 10.9090909 |
| England | Norwich | 1 | 10.1796407 |
| England | Preston | 1 | 9.9099099 |
| England | Swindon | 1 | 9.0909091 |
| England | Northampton | 1 | 9.0225564 |
| England | Chatham | 1 | 8.5889571 |
| England | Southampton | 1 | 8.4444444 |
| England | Warrington | 1 | 7.8740157 |
| England | Brighton | 1 | 7.2463768 |
| England | Portsmouth | 1 | 6.6869301 |
| England | Southend | 1 | 5.6250000 |
| England | Milton Keynes | 1 | 5.2631579 |
| England | Bournemouth | 1 | 3.3333333 |
| England | Luton | 1 | 3.3057851 |
| England | Reading | 1 | 2.5510204 |
| England | London | 1 | 2.0396913 |
| England | Crawley | 1 | 1.5151515 |
| England | Oxford | 1 | 1.2048193 |
| England | York | 1 | 0.8333333 |
| England | Peterborough | 2 | 26.7857143 |
| England | Luton | 2 | 23.9669421 |
| England | Blackburn | 2 | 20.0000000 |
| England | Birmingham | 2 | 19.5959596 |
| England | Ipswich | 2 | 18.8235294 |
| England | Mansfield | 2 | 18.4397163 |
| England | Huddersfield | 2 | 18.2170543 |
| England | Wakefield | 2 | 18.1818182 |
| England | Derby | 2 | 17.8807947 |
| England | Sunderland | 2 | 17.8378378 |
| England | Barnsley | 2 | 17.6870748 |
| England | Doncaster | 2 | 16.4948454 |
| England | Liverpool | 2 | 16.3265306 |
| England | Wigan | 2 | 16.0000000 |
| England | Stoke | 2 | 15.8995816 |
| England | Gloucester | 2 | 15.3846154 |
| England | Nottingham | 2 | 15.1364764 |
| England | Newcastle | 2 | 14.7940075 |
| England | Manchester | 2 | 14.3923965 |
| England | Northampton | 2 | 14.2857143 |
| England | Chatham | 2 | 14.1104294 |
| England | Bradford | 2 | 13.5483871 |
| England | London | 2 | 13.0466740 |
| England | Basildon | 2 | 12.7272727 |
| England | Blackpool | 2 | 12.4137931 |
| England | Portsmouth | 2 | 11.8541033 |
| England | Plymouth | 2 | 11.8012422 |
| England | Preston | 2 | 11.7117117 |
| England | Sheffield | 2 | 11.5234375 |
| England | Coventry | 2 | 11.2820513 |
| England | Southampton | 2 | 11.1111111 |
| England | Warrington | 2 | 11.0236220 |
| England | Oxford | 2 | 10.8433735 |
| England | Burnley | 2 | 10.2564103 |
| England | Leicester | 2 | 10.0694444 |
| England | Leeds | 2 | 9.9585062 |
| England | Birkenhead | 2 | 9.7087379 |
| England | Norwich | 2 | 9.5808383 |
| England | Southend | 2 | 9.3750000 |
| England | Telford | 2 | 9.3457944 |
| England | Hull | 2 | 9.0361446 |
| England | Middlesbrough | 2 | 8.8435374 |
| England | Slough | 2 | 8.7500000 |
| England | Exeter | 2 | 8.1081081 |
| England | Worthing | 2 | 7.6923077 |
| England | Brighton | 2 | 7.2463768 |
| England | Milton Keynes | 2 | 6.5789474 |
| England | Swindon | 2 | 6.0606061 |
| England | Bournemouth | 2 | 4.8888889 |
| England | Cambridge | 2 | 4.3478261 |
| England | York | 2 | 4.1666667 |
| England | Reading | 2 | 2.5510204 |
| England | Crawley | 2 | 1.5151515 |
| England | Bristol | 2 | 1.2121212 |
Scotland:
pua_imd %>%
  filter(country_name == "Scotland") %>%
  rename(imd_decile = index_of_multiple_deprivation_decile_country_specific) %>%
  arrange(imd_decile, desc(percentage)) %>%
  select(-n) %>%
knitr::kable()| country_name | PUA | imd_decile | percentage |
|---|---|---|---|
| Scotland | Dundee | 1 | 21.808511 |
| Scotland | Glasgow | 1 | 8.154506 |
| Scotland | Edinburgh | 1 | 6.197655 |
| Scotland | Aberdeen | 1 | 1.063830 |
| Scotland | Dundee | 2 | 14.893617 |
| Scotland | Edinburgh | 2 | 7.537688 |
| Scotland | Glasgow | 2 | 7.296137 |
| Scotland | Aberdeen | 2 | 6.737589 |
Wales:
pua_imd %>%
  filter(country_name == "Wales") %>%
  rename(imd_decile = index_of_multiple_deprivation_decile_country_specific) %>%
  arrange(imd_decile, desc(percentage)) %>%
  select(-n) %>%
knitr::kable()| country_name | PUA | imd_decile | percentage |
|---|---|---|---|
| Wales | Cardiff | 1 | 18.224299 |
| Wales | Newport | 1 | 16.774193 |
| Wales | Swansea | 1 | 12.970711 |
| Wales | Newport | 2 | 16.774193 |
| Wales | Swansea | 2 | 14.225941 |
| Wales | Cardiff | 2 | 9.345794 |
Summary
In England the PUAs experiencing the highest levels of deprivation (percentage of LSOAs in the two most deprived deciles) are:
- Liverpool
- Blackburn
- Hull
- Birmingham
- Bradford
- Burnley
- Peterborough
In Scotland, Dundee faces by far the highest levels of deprivation, followed (distantly) by Glasgow, Edinburgh and Aberdeen. If we were to pick only one location in Scotland, Dundee would be the best one.
In Wales, the three PUAs are not as dissimilar in terms of deprivation as they are in Scotland. That being said, Newport is experiencing the highest levels of deprivation, with Cardiff and Swansea following.
Access to Nature
Let’s now focus on what access people have to green spaces. It should be noted that parks and public gardens will be public, but playing fields may be private.
lsoa_parks_play_namesLooking at the variables included in this dataset again, the variables average_distance_to_nearest_park_public_garden_or_playing_field_m and average_size_of_nearest_park_public_garden_or_playing_field_m2 seem like the most promising for our purposes.
puas %>%
  ggplot(aes(x = average_distance_to_nearest_park_public_garden_or_playing_field_m)) +
  geom_histogram(binwidth = 20)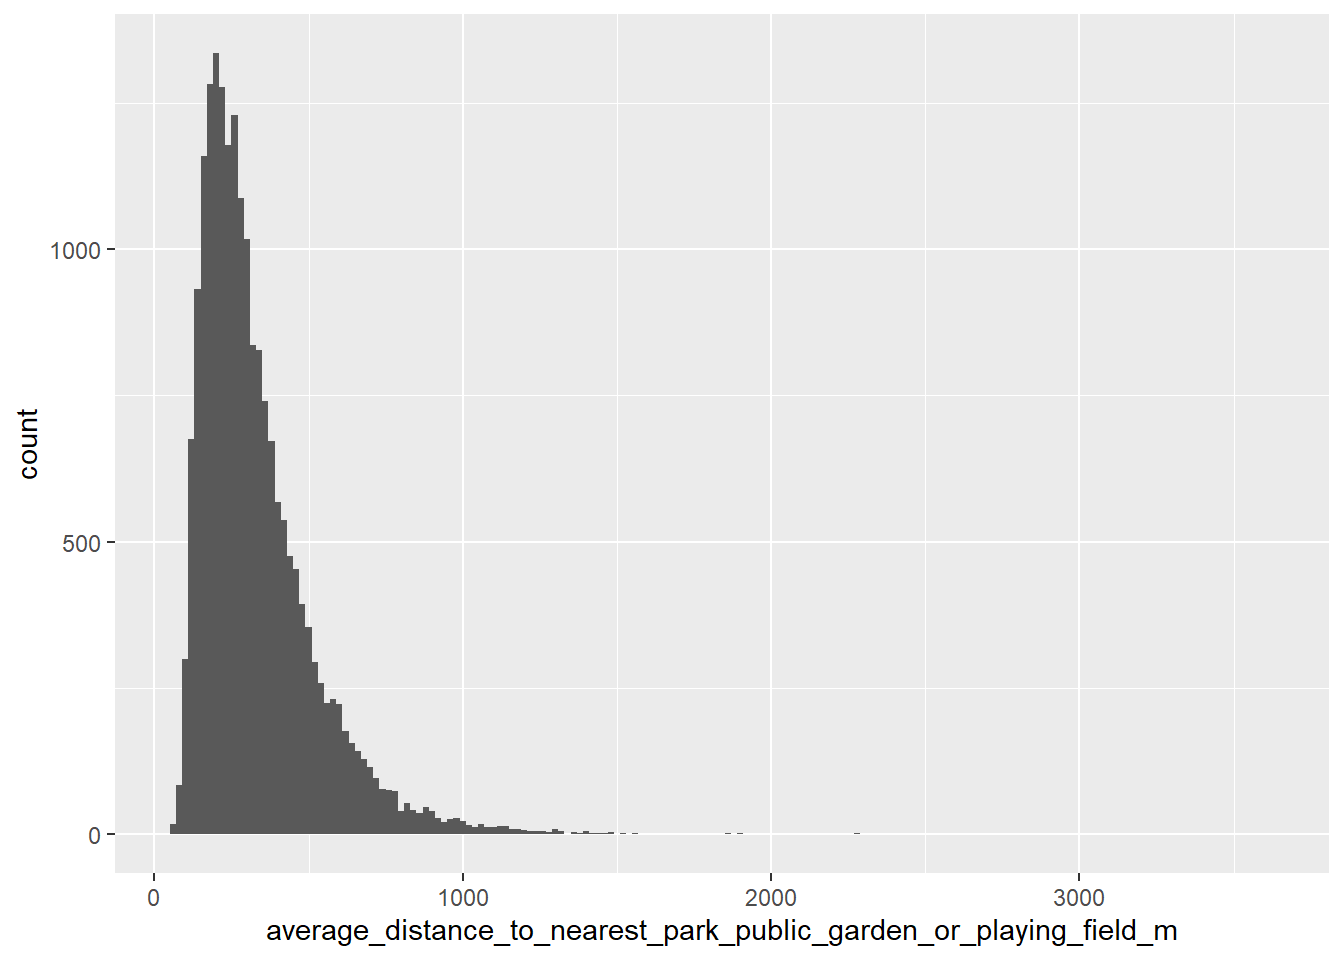
puas %>%
  # converting to km2 to avoid the plot having scientific notation
  mutate(avg_green_space_size_km2 = average_size_of_nearest_park_public_garden_or_playing_field_m2/(1000^2)) %>%
  ggplot(aes(x = avg_green_space_size_km2)) +
  geom_histogram(binwidth = .5)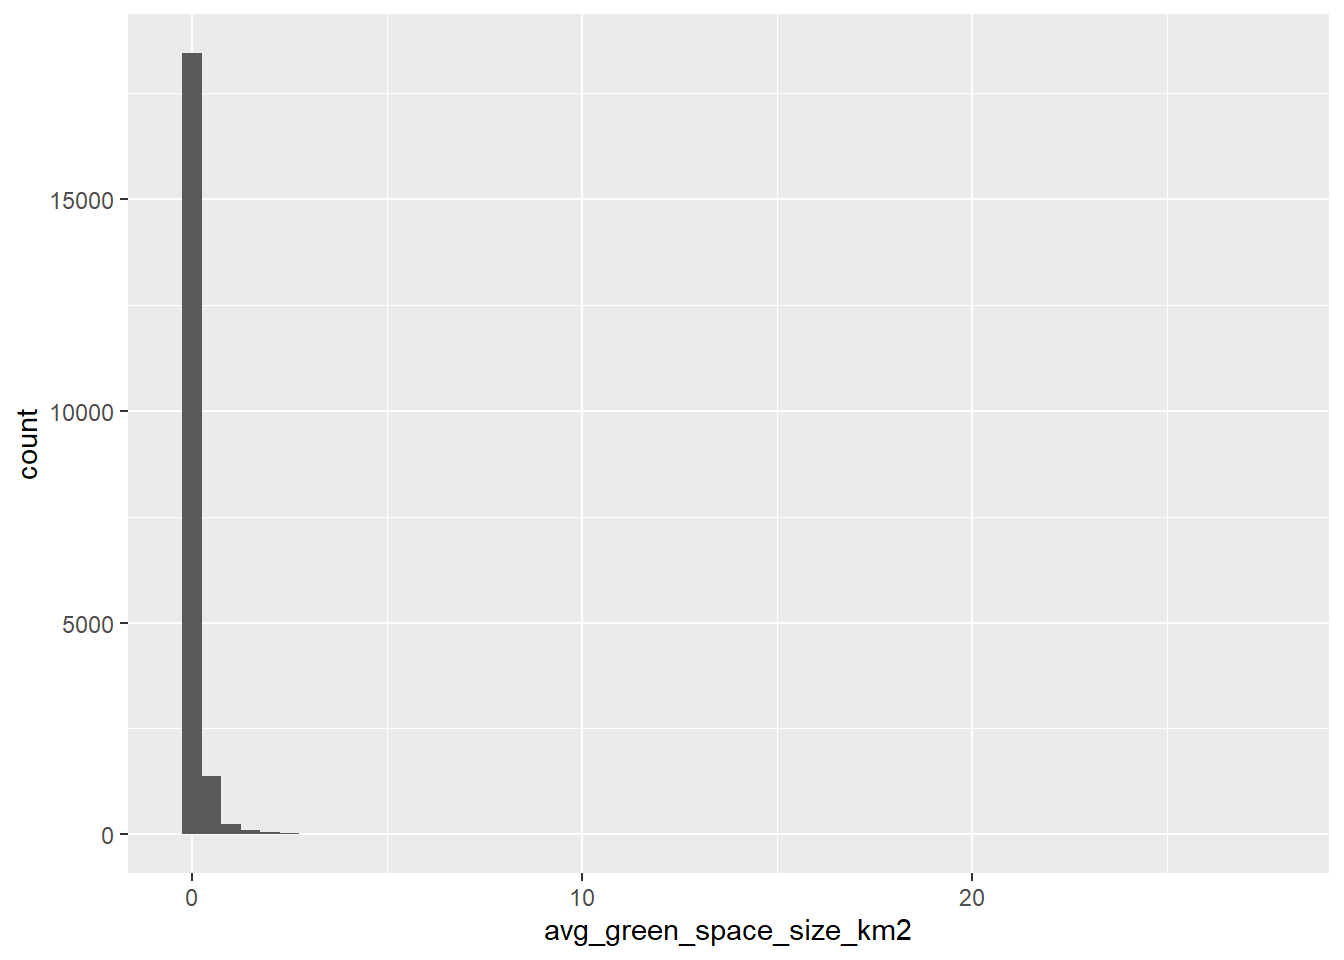
It looks like the vast majority of green spaces are at a distance of no more than 1500m. Most are also reasonably small.
The following plot shows the distribution of distances to nearest green spaces for each PUA. To make it easier to parse the plot, distances over 1500m have been excluded. Its purpose is to understand how evenly distributed distances in to green spaces in each LSOA are. London, Manchester and Birmingham look different to the rest because they are comprised of a vastly larger number of LSOAs.
puas %>%
  filter(average_distance_to_nearest_park_public_garden_or_playing_field_m < 1500) %>%
  ggplot(aes(x = average_distance_to_nearest_park_public_garden_or_playing_field_m)) +
  geom_histogram(binwidth = 10) +
  facet_wrap(~PUA)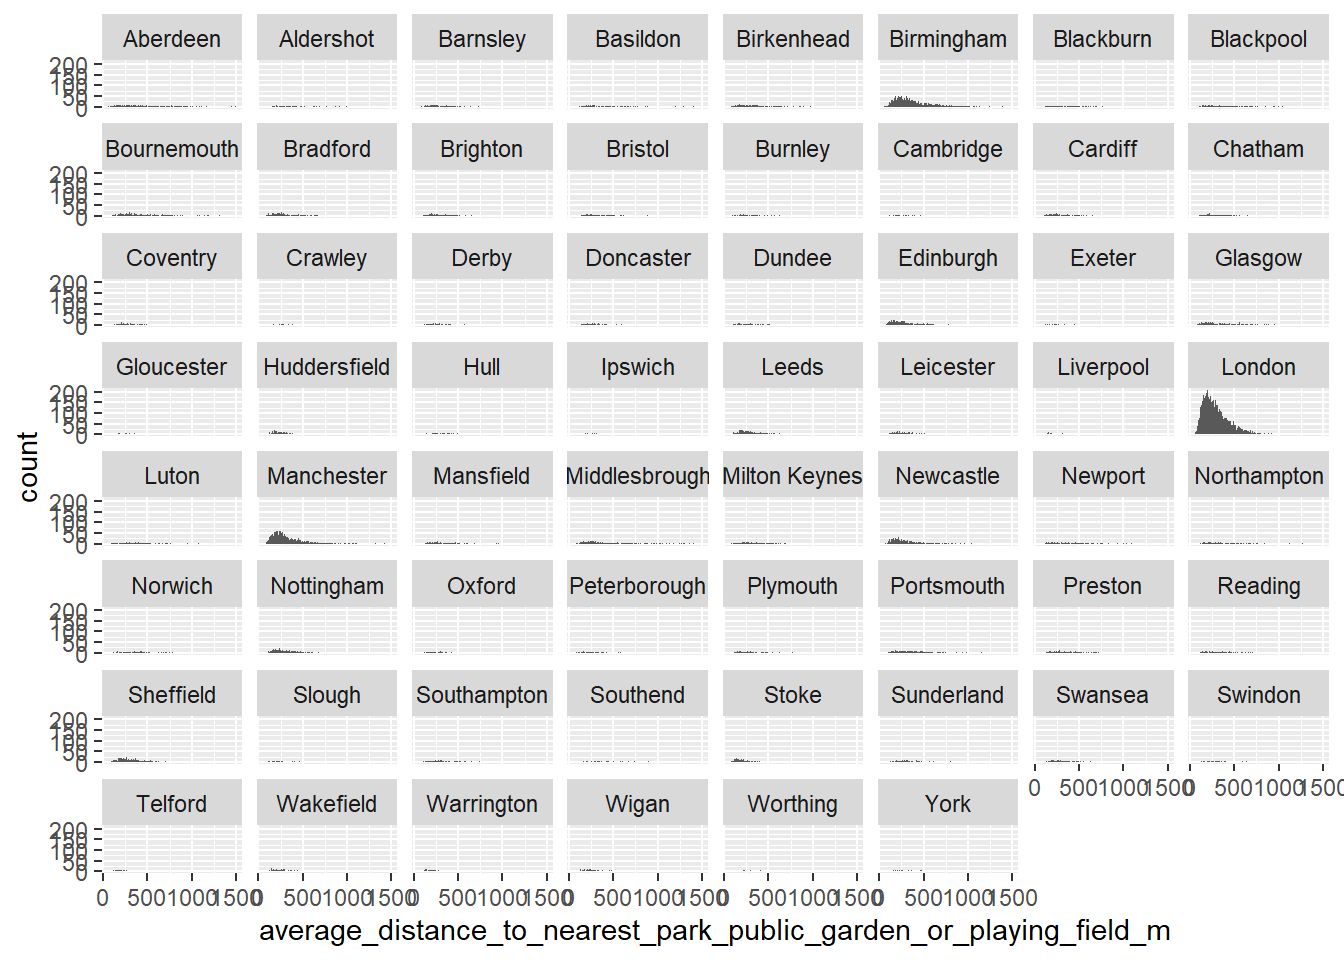
puas %>%
  group_by(PUA) %>%
  summarise(median_distance_to_gs = median(average_distance_to_nearest_park_public_garden_or_playing_field_m),
            median_size_gs = median(average_size_of_nearest_park_public_garden_or_playing_field_m2),
            mean_distance_to_gs = mean(average_distance_to_nearest_park_public_garden_or_playing_field_m),
            mean_size_gs = mean(average_size_of_nearest_park_public_garden_or_playing_field_m2)) %>%
  arrange(desc(median_distance_to_gs)) %>%
knitr::kable()| PUA | median_distance_to_gs | median_size_gs | mean_distance_to_gs | mean_size_gs |
|---|---|---|---|---|
| Southend | 435.7975 | 44180.48 | 480.7923 | 98015.42 |
| Norwich | 380.6522 | 33955.80 | 426.9153 | 54824.99 |
| Bournemouth | 376.8446 | 29026.00 | 492.9136 | 94828.62 |
| Hull | 369.0063 | 54560.64 | 397.3585 | 100272.57 |
| Aberdeen | 356.1986 | 45445.71 | 436.8731 | 115832.54 |
| Portsmouth | 351.0838 | 31623.72 | 410.6370 | 95448.57 |
| Glasgow | 349.9164 | 35245.64 | 431.0001 | 194403.87 |
| Preston | 342.5431 | 46568.68 | 389.7703 | 187819.65 |
| Swindon | 327.3520 | 43757.19 | 409.1535 | 117255.48 |
| Blackpool | 324.2464 | 25994.17 | 369.9097 | 67704.70 |
| Newport | 324.0550 | 25802.28 | 365.3463 | 61686.27 |
| Swansea | 320.8128 | 29069.38 | 384.2717 | 102805.47 |
| Bristol | 320.7222 | 33084.61 | 373.7540 | 59980.44 |
| Luton | 319.7229 | 55819.23 | 357.4806 | 91794.14 |
| Aldershot | 319.3042 | 38751.76 | 373.4855 | 61327.84 |
| Reading | 319.0948 | 46446.87 | 361.8391 | 86616.23 |
| Worthing | 317.7796 | 25318.40 | 346.9190 | 36576.55 |
| Birmingham | 317.0683 | 60941.85 | 360.0615 | 202255.23 |
| Blackburn | 314.8325 | 34917.37 | 345.9169 | 97256.03 |
| Southampton | 308.5161 | 45211.58 | 355.1405 | 144663.38 |
| York | 307.3236 | 25644.62 | 363.9983 | 44356.31 |
| Sunderland | 307.1010 | 40483.47 | 352.8014 | 78117.91 |
| Coventry | 306.5977 | 50026.75 | 344.5680 | 95523.53 |
| Ipswich | 305.9810 | 50559.54 | 336.3464 | 132663.26 |
| Northampton | 304.4572 | 70091.43 | 354.2851 | 135931.80 |
| Middlesbrough | 302.7591 | 48590.11 | 400.9074 | 92454.52 |
| Crawley | 302.0082 | 52333.78 | 348.3327 | 84680.01 |
| Birkenhead | 300.4390 | 47960.06 | 316.5288 | 90371.48 |
| Doncaster | 296.6762 | 29810.79 | 389.7785 | 59804.65 |
| Cambridge | 295.3498 | 44241.79 | 334.0155 | 72077.20 |
| Dundee | 293.0332 | 39846.23 | 326.5368 | 77006.72 |
| Basildon | 289.4019 | 51682.81 | 377.7235 | 109757.53 |
| Milton Keynes | 284.2410 | 82438.33 | 315.2818 | 160540.78 |
| Plymouth | 283.3780 | 24185.25 | 356.1489 | 77676.46 |
| Leeds | 282.5147 | 35048.66 | 344.2917 | 80080.00 |
| Brighton | 280.6280 | 27116.75 | 313.6029 | 55018.21 |
| Sheffield | 280.0162 | 51126.42 | 318.3833 | 96380.70 |
| Wigan | 279.3162 | 30540.51 | 349.4226 | 108833.93 |
| Derby | 279.0213 | 47889.95 | 312.8657 | 102906.52 |
| Leicester | 277.8655 | 50931.59 | 309.2846 | 88607.76 |
| Nottingham | 276.3806 | 28610.90 | 328.2084 | 126998.75 |
| Chatham | 273.0040 | 26932.48 | 302.9952 | 71754.71 |
| Peterborough | 269.2324 | 35984.50 | 340.6852 | 108514.40 |
| Manchester | 268.6999 | 37003.01 | 314.1329 | 95336.34 |
| Wakefield | 268.1722 | 35257.61 | 305.8791 | 61202.44 |
| Mansfield | 268.0402 | 26038.61 | 298.7354 | 67872.90 |
| Bradford | 266.9105 | 24445.81 | 312.4879 | 41404.47 |
| London | 265.2033 | 47824.39 | 300.8989 | 166385.74 |
| Slough | 262.0483 | 39769.10 | 301.8238 | 64745.06 |
| Burnley | 260.9662 | 30305.36 | 303.7838 | 37238.11 |
| Cardiff | 258.7643 | 41520.86 | 295.4089 | 86871.55 |
| Edinburgh | 258.1939 | 53851.07 | 307.5713 | 139277.90 |
| Gloucester | 255.6391 | 43626.32 | 277.9223 | 81944.83 |
| Exeter | 248.9105 | 34102.18 | 299.4274 | 66662.03 |
| Barnsley | 243.0617 | 34986.22 | 274.4908 | 76807.89 |
| Huddersfield | 241.5561 | 20089.18 | 275.9462 | 41013.53 |
| Newcastle | 236.9647 | 37867.82 | 275.3651 | 86985.39 |
| Oxford | 236.8857 | 34346.81 | 268.2949 | 76436.94 |
| Liverpool | 217.9780 | 54851.73 | 265.7847 | 96999.55 |
| Warrington | 210.7551 | 43085.68 | 242.8104 | 66868.64 |
| Telford | 209.1717 | 31881.45 | 278.2674 | 55407.03 |
| Stoke | 196.6337 | 49093.15 | 266.5114 | 120014.92 |
Summary
Of the candidate places from the deprivation data, Hull is the only one that scores pretty high in distance to green spaces. Birmingham and Blackburn are in second and third place, though quite far behind Hull. The rest of the places in England are actually pretty close to green spaces. All in all, however, even in the places with the largest distances from green space, the median distances are pretty small and less than 500m in all cases.
Regarding the other GB countries, Newport is the Welsh PUA with the largest distances from green spaces and Aberdeen the Scottish one. Note, however, that Aberdeen had the lowest levels of deprivation in the Scottish PUAs.
There is a longer discussion to be had here about which the most appropriate metric is when thinking about access to nature, especially in the context of PGP. Critically, because PGP will not create new green spaces, we perhaps should be looking at the places with the best access to green spaces. This could be beneficial for the success of the project, as PGPs will have to be created in existing areas; the easier to access these are the better.
Additionally, this dataset has many limitations, one of which being that the play areas included in the dataset could be private.
Cross-checking with Income Deprivation Affecting Children Index (IDACI; England)
This data relates to the English indices of deprivation 2019.
The data was downloaded from the GOV.UK website and was made available by the Ministry of Housing, Communities & Local Government.
excel_sheets(here("data-raw", "File_3_-_IoD2019_Supplementary_Indices_-_IDACI_and_IDAOPI.xlsx"))idaci_idaopi <- read_excel(here("data-raw", "File_3_-_IoD2019_Supplementary_Indices_-_IDACI_and_IDAOPI.xlsx"),
sheet = 2) %>%
clean_names()
names(idaci_idaopi)Code
idaci <- idaci_idaopi %>%
  select(lsoa_code = lsoa_code_2011,
         lsoa_name = lsoa_name_2011,
         lad_name = local_authority_district_name_2019,
         lad_code = local_authority_district_code_2019,
         imd_rank = index_of_multiple_deprivation_imd_rank_where_1_is_most_deprived,
         imd_decile = index_of_multiple_deprivation_imd_decile_where_1_is_most_deprived_10_percent_of_lso_as,
         idaci_rank = income_deprivation_affecting_children_index_idaci_rank_where_1_is_most_deprived,
         idaci_decile = income_deprivation_affecting_children_index_idaci_decile_where_1_is_most_deprived_10_percent_of_lso_as) %>%
  mutate(pua = case_when(
    # the CfC table had this LAD down as Aberdeen. ideally check if Aberdeen City is what is meant, as there is also Aberdeenshire
           lad_name == "Aberdeen City" ~ "Aberdeen",
           lad_name == "Rusmoor" ~ "Aldershot",
           lad_name == "Surrey Heath" ~ "Aldershot",
           lad_name == "Barnsley" ~ "Barnsley",
           lad_name == "Basildon" ~ "Basildon",
           lad_name == "Wirral" ~ "Birkenhead",
           lad_name == "Birmingham" ~ "Birmingham",
           lad_name == "Dudley" ~ "Birmingham",
           lad_name == "Sandwell" ~ "Birmingham",
           lad_name == "Solihull" ~ "Birmingham",
           lad_name == "Walsall" ~ "Birmingham",
           lad_name == "Wolverhampton" ~ "Birmingham",
           lad_name == "Blackburn with Darwen" ~ "Blackburn",
           lad_name == "Blackpool" ~ "Blackpool",
           lad_name == "Fylde" ~ "Blackpool",
           lad_name == "Dorset" ~ "Bournemouth",
           lad_name == "Bournemouth, Christchurch and Poole" ~ "Bournemouth",
           lad_name == "Bradford" ~ "Bradford",
           lad_name == "Adur" ~ "Brighton",
           lad_name == "Brighton and Hove" ~ "Brighton",
           lad_name == "City of Bristol" ~ "Bristol",
           lad_name == "South Gloucestershire" ~ "Bristol",
           lad_name == "Burnley" ~ "Burnley",
           lad_name == "Pendle" ~ "Burnley",
           lad_name == "Cambridge" ~ "Cambridge",
           lad_name == "Cardiff" ~ "Cardiff",
           lad_name == "Medway" ~ "Chatham",
           lad_name == "Coventry" ~ "Coventry",
           lad_name == "Crawley" ~ "Crawley",
           lad_name == "Derby" ~ "Derby",
           lad_name == "Doncaster" ~ "Doncaster",
           # the CfC table had this LAD down as Dundee
           lad_name == "Dundee City" ~ "Dundee",
           # the CfC table had this LAD down as Edinburgh
           lad_name == "City of Edinburgh" ~ "Edinburgh",
           lad_name == "Exeter" ~ "Exeter",
           lad_name == "East Dunbartonshire" ~ "Glasgow",
           lad_name == "East Renfrewshire" ~ "Glasgow",
           lad_name == "Glasgow" ~ "Glasgow",
           lad_name == "Renfrewshire" ~ "Glasgow",
           lad_name == "Gloucester" ~ "Gloucester",
           lad_name == "Kirklees" ~ "Huddersfield",
           # the CfC table had this LAD down as Kingston upon Hull
           lad_name == "Kingston upon Hull, City of" ~ "Hull",
           lad_name == "Ipswich" ~ "Ipswich",
           lad_name == "Leeds" ~ "Leeds",
           lad_name == "Blaby" ~ "Leicester",
           lad_name == "Leicester" ~ "Leicester",
           lad_name == "Oadby and Wigston" ~ "Leicester",
           lad_name == "Knowsley" ~ "Liverpool",
           lad_name == "Barking and Dagenham" ~ "London",
           lad_name == "Barnet" ~ "London",
           lad_name == "Bexley" ~ "London",
           lad_name == "Brent" ~ "London",
           lad_name == "Bromley" ~ "London",
           lad_name == "Broxbourne" ~ "London",
           lad_name == "Camden" ~ "London",
           lad_name == "City of London" ~ "London",
           lad_name == "Croydon" ~ "London",
           lad_name == "Dartford" ~ "London",
           lad_name == "Ealing" ~ "London",
           lad_name == "Elmbridge" ~ "London",
           lad_name == "Enfield" ~ "London",
           lad_name == "Epping Forest" ~ "London",
           lad_name == "Epsom and Ewell" ~ "London",
           lad_name == "Gravesham" ~ "London",
           lad_name == "Greenwich" ~ "London",
           lad_name == "Hackney" ~ "London",
           lad_name == "Hammersmith and Fulham" ~ "London",
           lad_name == "Haringey" ~ "London",
           lad_name == "Harrow" ~ "London",
           lad_name == "Havering" ~ "London",
           lad_name == "Hertsmere" ~ "London",
           lad_name == "Hillingdon" ~ "London",
           lad_name == "Hounslow" ~ "London",
           lad_name == "Islington" ~ "London",
           lad_name == "Kensington and Chelsea" ~ "London",
           lad_name == "Kingston upon Thames" ~ "London",
           lad_name == "Lambeth" ~ "London",
           lad_name == "Lewisham" ~ "London",
           lad_name == "Merton" ~ "London",
           lad_name == "Newham" ~ "London",
           lad_name == "Redbridge" ~ "London",
           lad_name == "Richard upon Thames" ~ "London",
           lad_name == "Runnymede" ~ "London",
           lad_name == "Southwark" ~ "London",
           lad_name == "Spelthorne" ~ "London",
           lad_name == "Sutton" ~ "London",
           lad_name == "Three Rivers" ~ "London",
           lad_name == "Tower Hamlets" ~ "London",
           lad_name == "Waltham Forest" ~ "London",
           lad_name == "Wandsworth" ~ "London",
           lad_name == "Watford" ~ "London",
           lad_name == "Westminster" ~ "London",
           lad_name == "Woking" ~ "London",
           lad_name == "Luton" ~ "Luton",
           lad_name == "Bolton" ~ "Manchester",
           lad_name == "Bury" ~ "Manchester",
           lad_name == "Manchester" ~ "Manchester",
           lad_name == "Oldham" ~ "Manchester",
           lad_name == "Rochdale" ~ "Manchester",
           lad_name == "Salford" ~ "Manchester",
           lad_name == "Stockport" ~ "Manchester",
           lad_name == "Tameside" ~ "Manchester",
           lad_name == "Trafford" ~ "Manchester",
           lad_name == "Ashfield" ~ "Mansfield",
           lad_name == "Mansfield" ~ "Mansfield",
           lad_name == "Middlesbrough" ~ "Middlesbrough",
           lad_name == "Redcar and Cleveland" ~ "Middlesbrough",
           lad_name == "Stockton-on-Tees" ~ "Middlesbrough",
           lad_name == "Milton Keynes" ~ "Milton Keynes",
           lad_name == "Gateshead" ~ "Newcastle",
           lad_name == "Newcastle upon Tyne" ~ "Newcastle",
           lad_name == "North Tyneside" ~ "Newcastle",
           lad_name == "South Tyneside" ~ "Newcastle",
           lad_name == "Newport" ~ "Newport",
           lad_name == "Torfaen" ~ "Newport",
           # the CfC table only lists the LAD of West Northamptonshire
           # this does not exist in the data
           # only East Northamptonshire and Northampton exist
           # this warrants further investigation
           lad_name == "Northampton" ~ "Northampton",
           lad_name == "Broadland" ~ "Norwich",
           lad_name == "Norwich" ~ "Norwich",
           lad_name == "Broxtowe" ~ "Nottingham",
           lad_name == "Erewash" ~ "Nottingham",
           lad_name == "Gedling" ~ "Nottingham",
           lad_name == "Nottingham" ~ "Nottingham",
           lad_name == "Oxford" ~ "Oxford",
           lad_name == "Peterborough" ~ "Peterborough",
           lad_name == "Plymouth" ~ "Plymouth",
           lad_name == "Portsmouth" ~ "Portsmouth",
           lad_name == "Fareham" ~ "Portsmouth",
           lad_name == "Gosport" ~ "Portsmouth",
           lad_name == "Havant" ~ "Portsmouth",
           lad_name == "Chorley" ~ "Preston",
           lad_name == "Preston" ~ "Preston",
           lad_name == "South Ribble" ~ "Preston",
           lad_name == "Reading" ~ "Reading",
           lad_name == "Wokingham" ~ "Reading",
           lad_name == "Rotherham" ~ "Sheffield",
           lad_name == "Sheffield" ~ "Sheffield",
           lad_name == "Slough" ~ "Slough",
           lad_name == "Eastleigh" ~ "Southampton",
           lad_name == "Southampton" ~ "Southampton",
           lad_name == "Castlepoint" ~ "Southend",
           lad_name == "Southend-on-Sea" ~ "Southend",
           lad_name == "Rochford" ~ "Southend",
           lad_name == "Newcastle-under-Lyme" ~ "Stoke",
           lad_name == "Stoke-on-Trent" ~ "Stoke",
           lad_name == "Sunderland" ~ "Sunderland",
           lad_name == "Neath Port Talbot" ~ "Swansea",
           lad_name == "Swansea" ~ "Swansea",
           lad_name == "Swindon" ~ "Swindon",
           lad_name == "Telford and Wrekin" ~ "Telford",
           lad_name == "Wakefield" ~ "Wakefield",
           lad_name == "Warrington" ~ "Warrington",
           lad_name == "Wigan" ~ "Wigan",
           lad_name == "Worthing" ~ "Worthing",
           lad_name == "York" ~ "York"
          ))
idaci %>%
count(pua, idaci_decile) %>%
group_by(pua) %>%
mutate(percentage = (n/sum(n)) * 100) %>%
ungroup() %>%
filter(idaci_decile %in% 1:2) %>%
arrange(idaci_decile, desc(percentage)) %>%
select(-n) %>%
knitr::kable()| pua | idaci_decile | percentage |
|---|---|---|
| Liverpool | 1 | 44.897959 |
| Hull | 1 | 37.951807 |
| Middlesbrough | 1 | 30.612245 |
| Sunderland | 1 | 25.945946 |
| Birmingham | 1 | 25.521885 |
| Birkenhead | 1 | 23.300971 |
| Newcastle | 1 | 22.097378 |
| Blackpool | 1 | 22.068966 |
| Doncaster | 1 | 20.618557 |
| Sheffield | 1 | 20.117188 |
| Leeds | 1 | 19.917012 |
| Nottingham | 1 | 19.602978 |
| Blackburn | 1 | 18.681319 |
| Manchester | 1 | 18.194162 |
| Stoke | 1 | 17.991632 |
| Barnsley | 1 | 17.687075 |
| Bradford | 1 | 16.451613 |
| Coventry | 1 | 16.410256 |
| Telford | 1 | 14.814815 |
| Derby | 1 | 14.569536 |
| Mansfield | 1 | 14.184397 |
| Plymouth | 1 | 13.043478 |
| Leicester | 1 | 12.847222 |
| Basildon | 1 | 11.818182 |
| Ipswich | 1 | 11.764706 |
| Peterborough | 1 | 11.607143 |
| Burnley | 1 | 11.111111 |
| Chatham | 1 | 10.429448 |
| Gloucester | 1 | 10.256410 |
| Norwich | 1 | 10.179641 |
| Wakefield | 1 | 10.047847 |
| Wigan | 1 | 10.000000 |
| Southend | 1 | 9.375000 |
| Luton | 1 | 9.090909 |
| Southampton | 1 | 8.444444 |
| Swindon | 1 | 8.333333 |
| Brighton | 1 | 8.212560 |
| Huddersfield | 1 | 7.722008 |
| Northampton | 1 | 7.518797 |
| Portsmouth | 1 | 6.990882 |
| Preston | 1 | 6.756757 |
| London | 1 | 6.413083 |
| NA | 1 | 6.343360 |
| Warrington | 1 | 4.724409 |
| Milton Keynes | 1 | 4.605263 |
| Exeter | 1 | 4.054054 |
| Oxford | 1 | 3.614458 |
| Bournemouth | 1 | 2.876106 |
| Reading | 1 | 2.040816 |
| York | 1 | 1.666667 |
| Crawley | 1 | 1.515151 |
| Burnley | 2 | 22.222222 |
| Mansfield | 2 | 20.567376 |
| Blackburn | 2 | 19.780220 |
| Birmingham | 2 | 18.787879 |
| Peterborough | 2 | 17.857143 |
| Bradford | 2 | 17.741936 |
| Barnsley | 2 | 17.006803 |
| Ipswich | 2 | 16.470588 |
| Manchester | 2 | 15.818058 |
| Plymouth | 2 | 15.527950 |
| Coventry | 2 | 15.384615 |
| Chatham | 2 | 15.337423 |
| Sunderland | 2 | 15.135135 |
| Stoke | 2 | 15.062762 |
| Nottingham | 2 | 14.888338 |
| Hull | 2 | 14.457831 |
| Newcastle | 2 | 14.419476 |
| Wigan | 2 | 14.000000 |
| London | 2 | 13.947078 |
| Doncaster | 2 | 13.917526 |
| Derby | 2 | 13.907285 |
| Wakefield | 2 | 13.875598 |
| Basildon | 2 | 13.636364 |
| Preston | 2 | 13.513514 |
| Sheffield | 2 | 12.304688 |
| Leicester | 2 | 12.152778 |
| Gloucester | 2 | 11.538462 |
| Huddersfield | 2 | 10.424710 |
| Liverpool | 2 | 10.204082 |
| Norwich | 2 | 10.179641 |
| Leeds | 2 | 9.751037 |
| Portsmouth | 2 | 9.726444 |
| Oxford | 2 | 9.638554 |
| Middlesbrough | 2 | 9.523810 |
| Telford | 2 | 9.259259 |
| Southampton | 2 | 8.888889 |
| Blackpool | 2 | 8.275862 |
| Luton | 2 | 8.264463 |
| Warrington | 2 | 7.874016 |
| Brighton | 2 | 7.729469 |
| Worthing | 2 | 7.692308 |
| York | 2 | 7.500000 |
| Milton Keynes | 2 | 7.236842 |
| Southend | 2 | 6.875000 |
| Swindon | 2 | 6.818182 |
| Birkenhead | 2 | 6.796117 |
| Bournemouth | 2 | 6.415929 |
| NA | 2 | 6.118273 |
| Northampton | 2 | 6.015038 |
| Reading | 2 | 5.102041 |
| Crawley | 2 | 4.545454 |
| Exeter | 2 | 4.054054 |
| Cambridge | 2 | 2.898551 |
| Slough | 2 | 2.500000 |
| Bristol | 2 | 2.424242 |
The children-specific index would suggest that the most relevant cities for our purposes are:
- Liverpool
- Hull
- Birmingham
- Blackburn
- Bradford
Candidate places
| Country | PUA |
|---|---|
| England | Hull |
| England | Liverpool |
| England | Birmingham |
| England | Blackburn |
| England | Bradford |
| Scotland | Dundee |
| Scotland | Glasgow |
| Wales | Newport |
| Wales | Cardiff |
| N. Ireland | Belfast |