Getting started with data in R
The RSA
Last time you learned how to:
- ✅ Interact with the RStudio GUI,
- ✅ Set up projects,
- ✅ Create files from RStudio,
- ✅ Assign values to objects,
- ✅ Use functions,
- ✅ Create and subset vectors,
- ✅ Work with missing data
Questions from last time?
Learning objectives
- Read data into R.
- Understand and manipulate
data.framesortibbles. - Understand and manipulate
factors. - Alternate between date formats.
Data frames
data.frames are the standard data structure for tabular data in R.
They look very similar to spreadsheets (like in Excel) but each column is, in fact, a vector:
- Each vector needs to be of the same length, for a perfect rectangle.
- Because the columns are all vectors, they must all be of the same type.
A note on terminology
Technically, what we will be working with in these workshops aren’t data.frames, they are tibbles. tibbles are basically dataframes for the tidyverse - they have some subtle differences but nothing you need to worry about at this point.
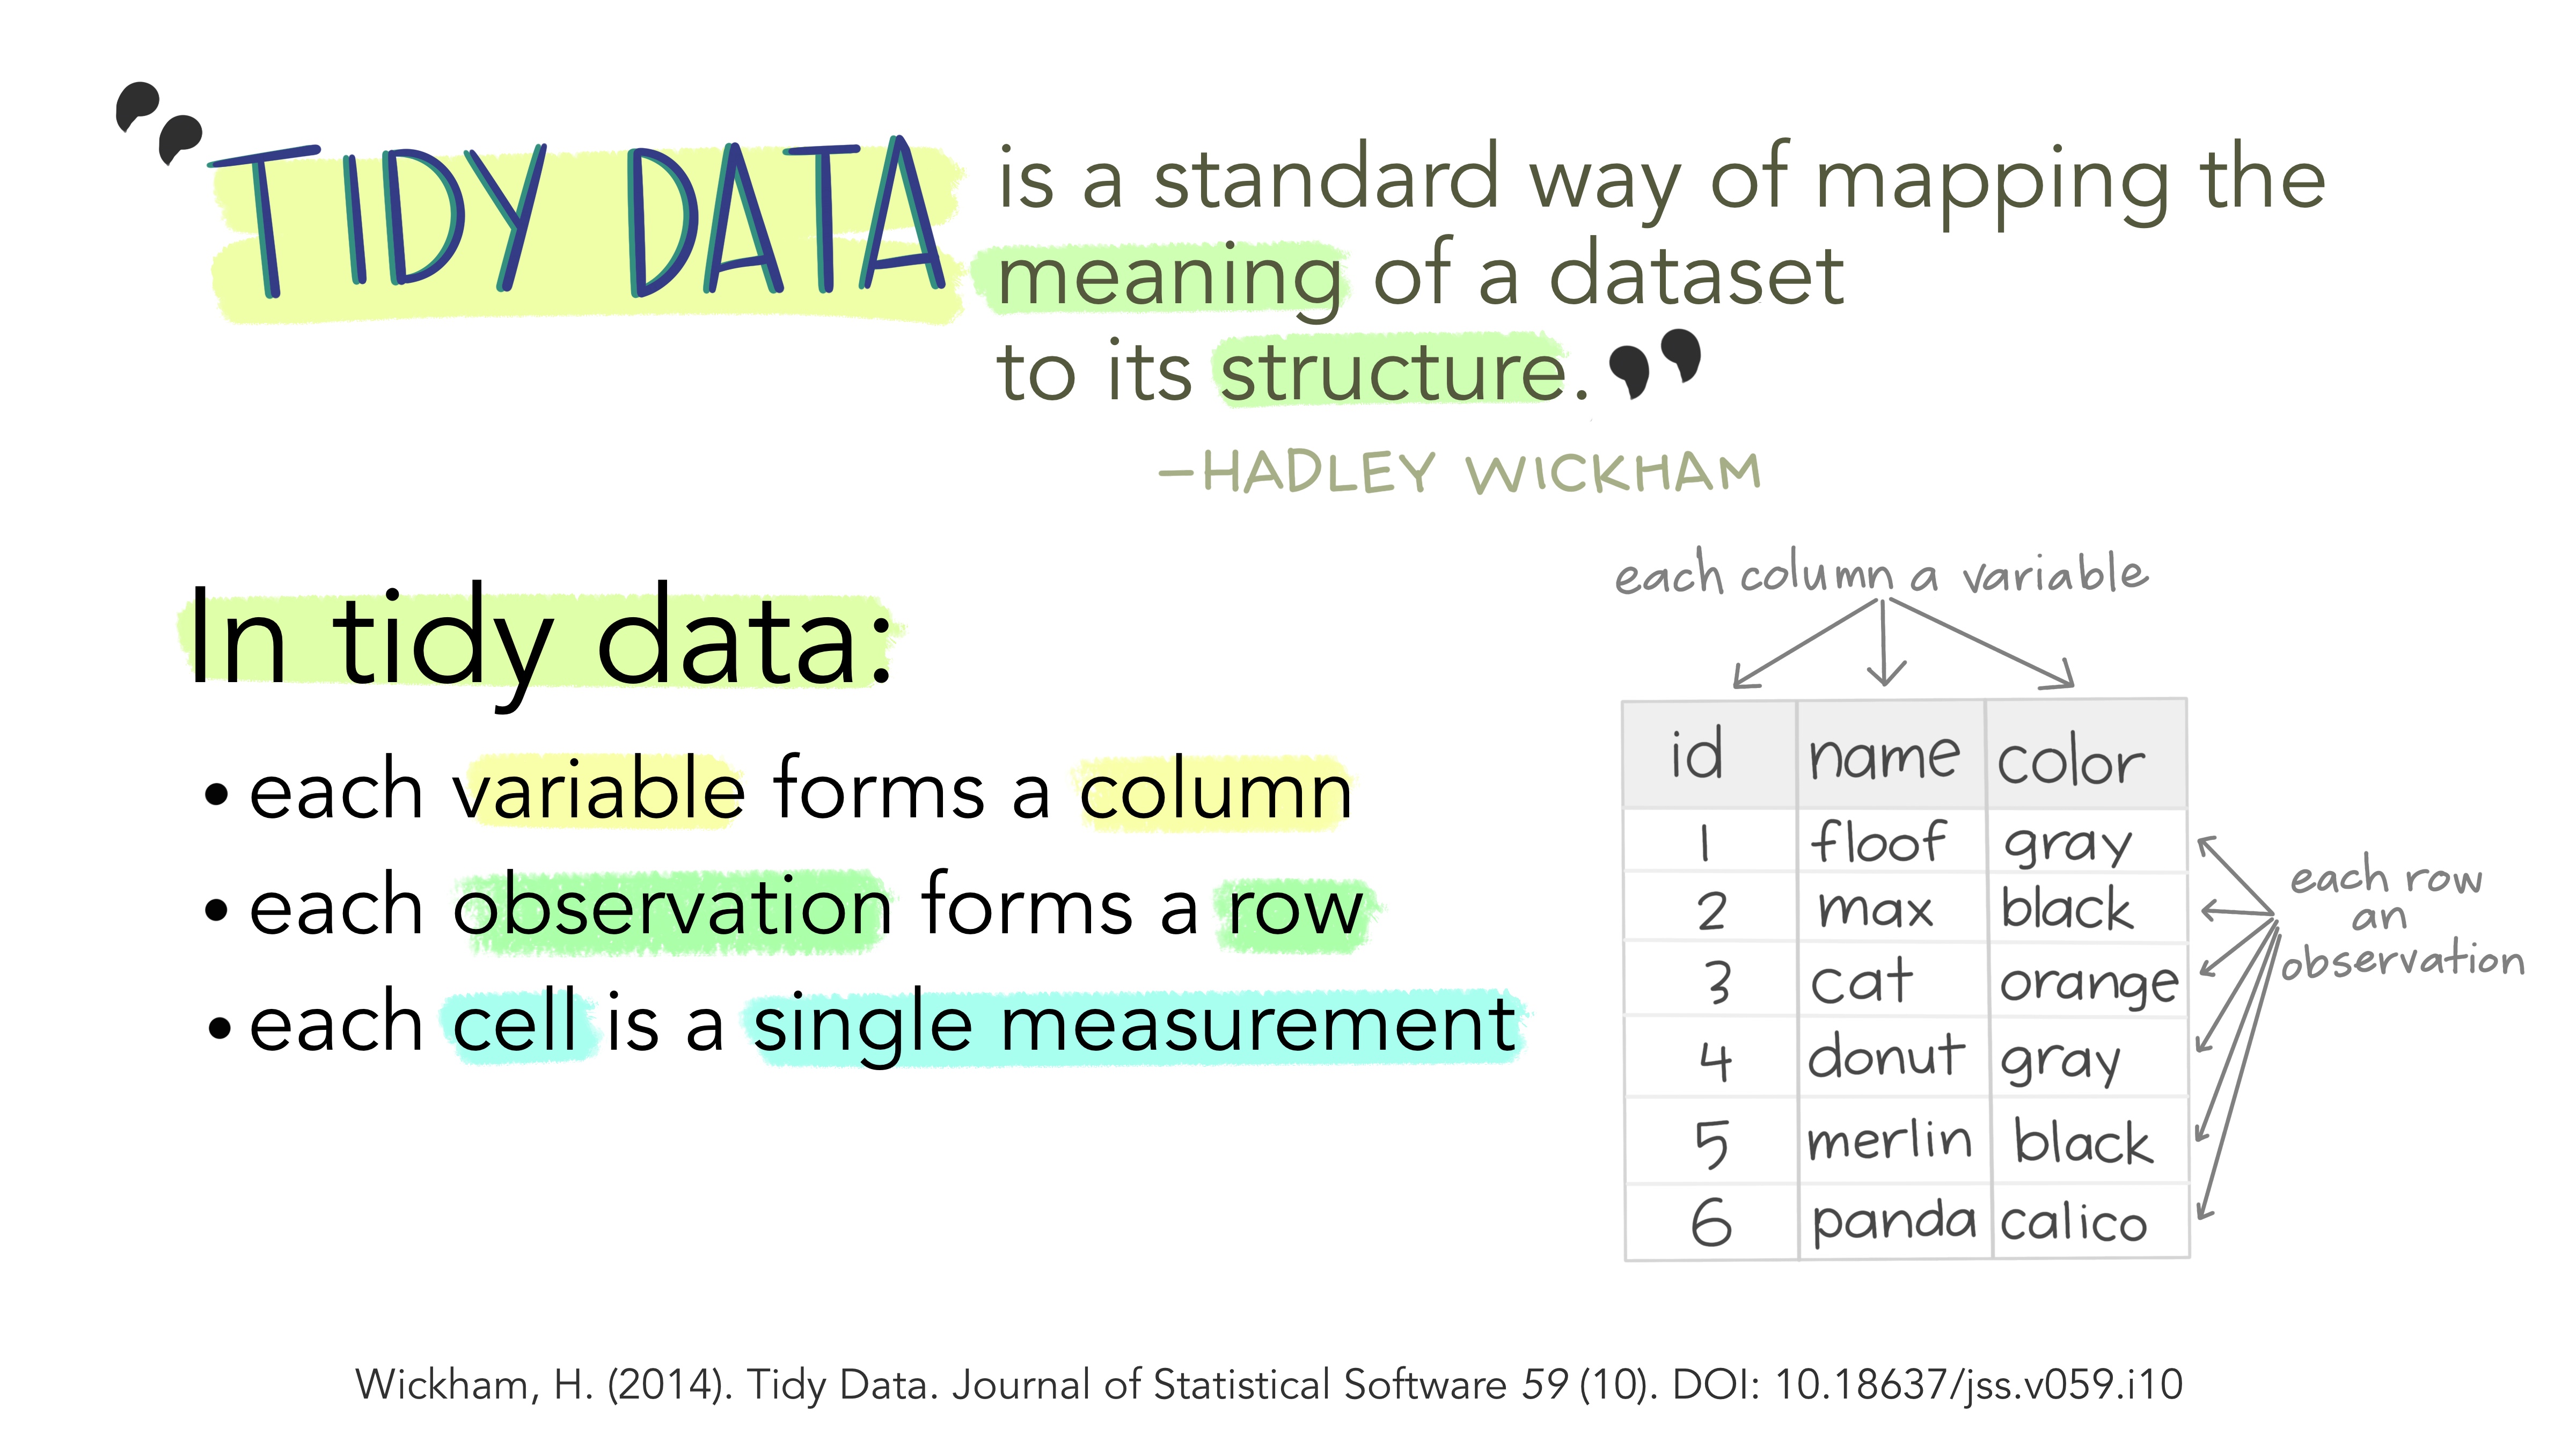
Tabular data: What is tidy data?

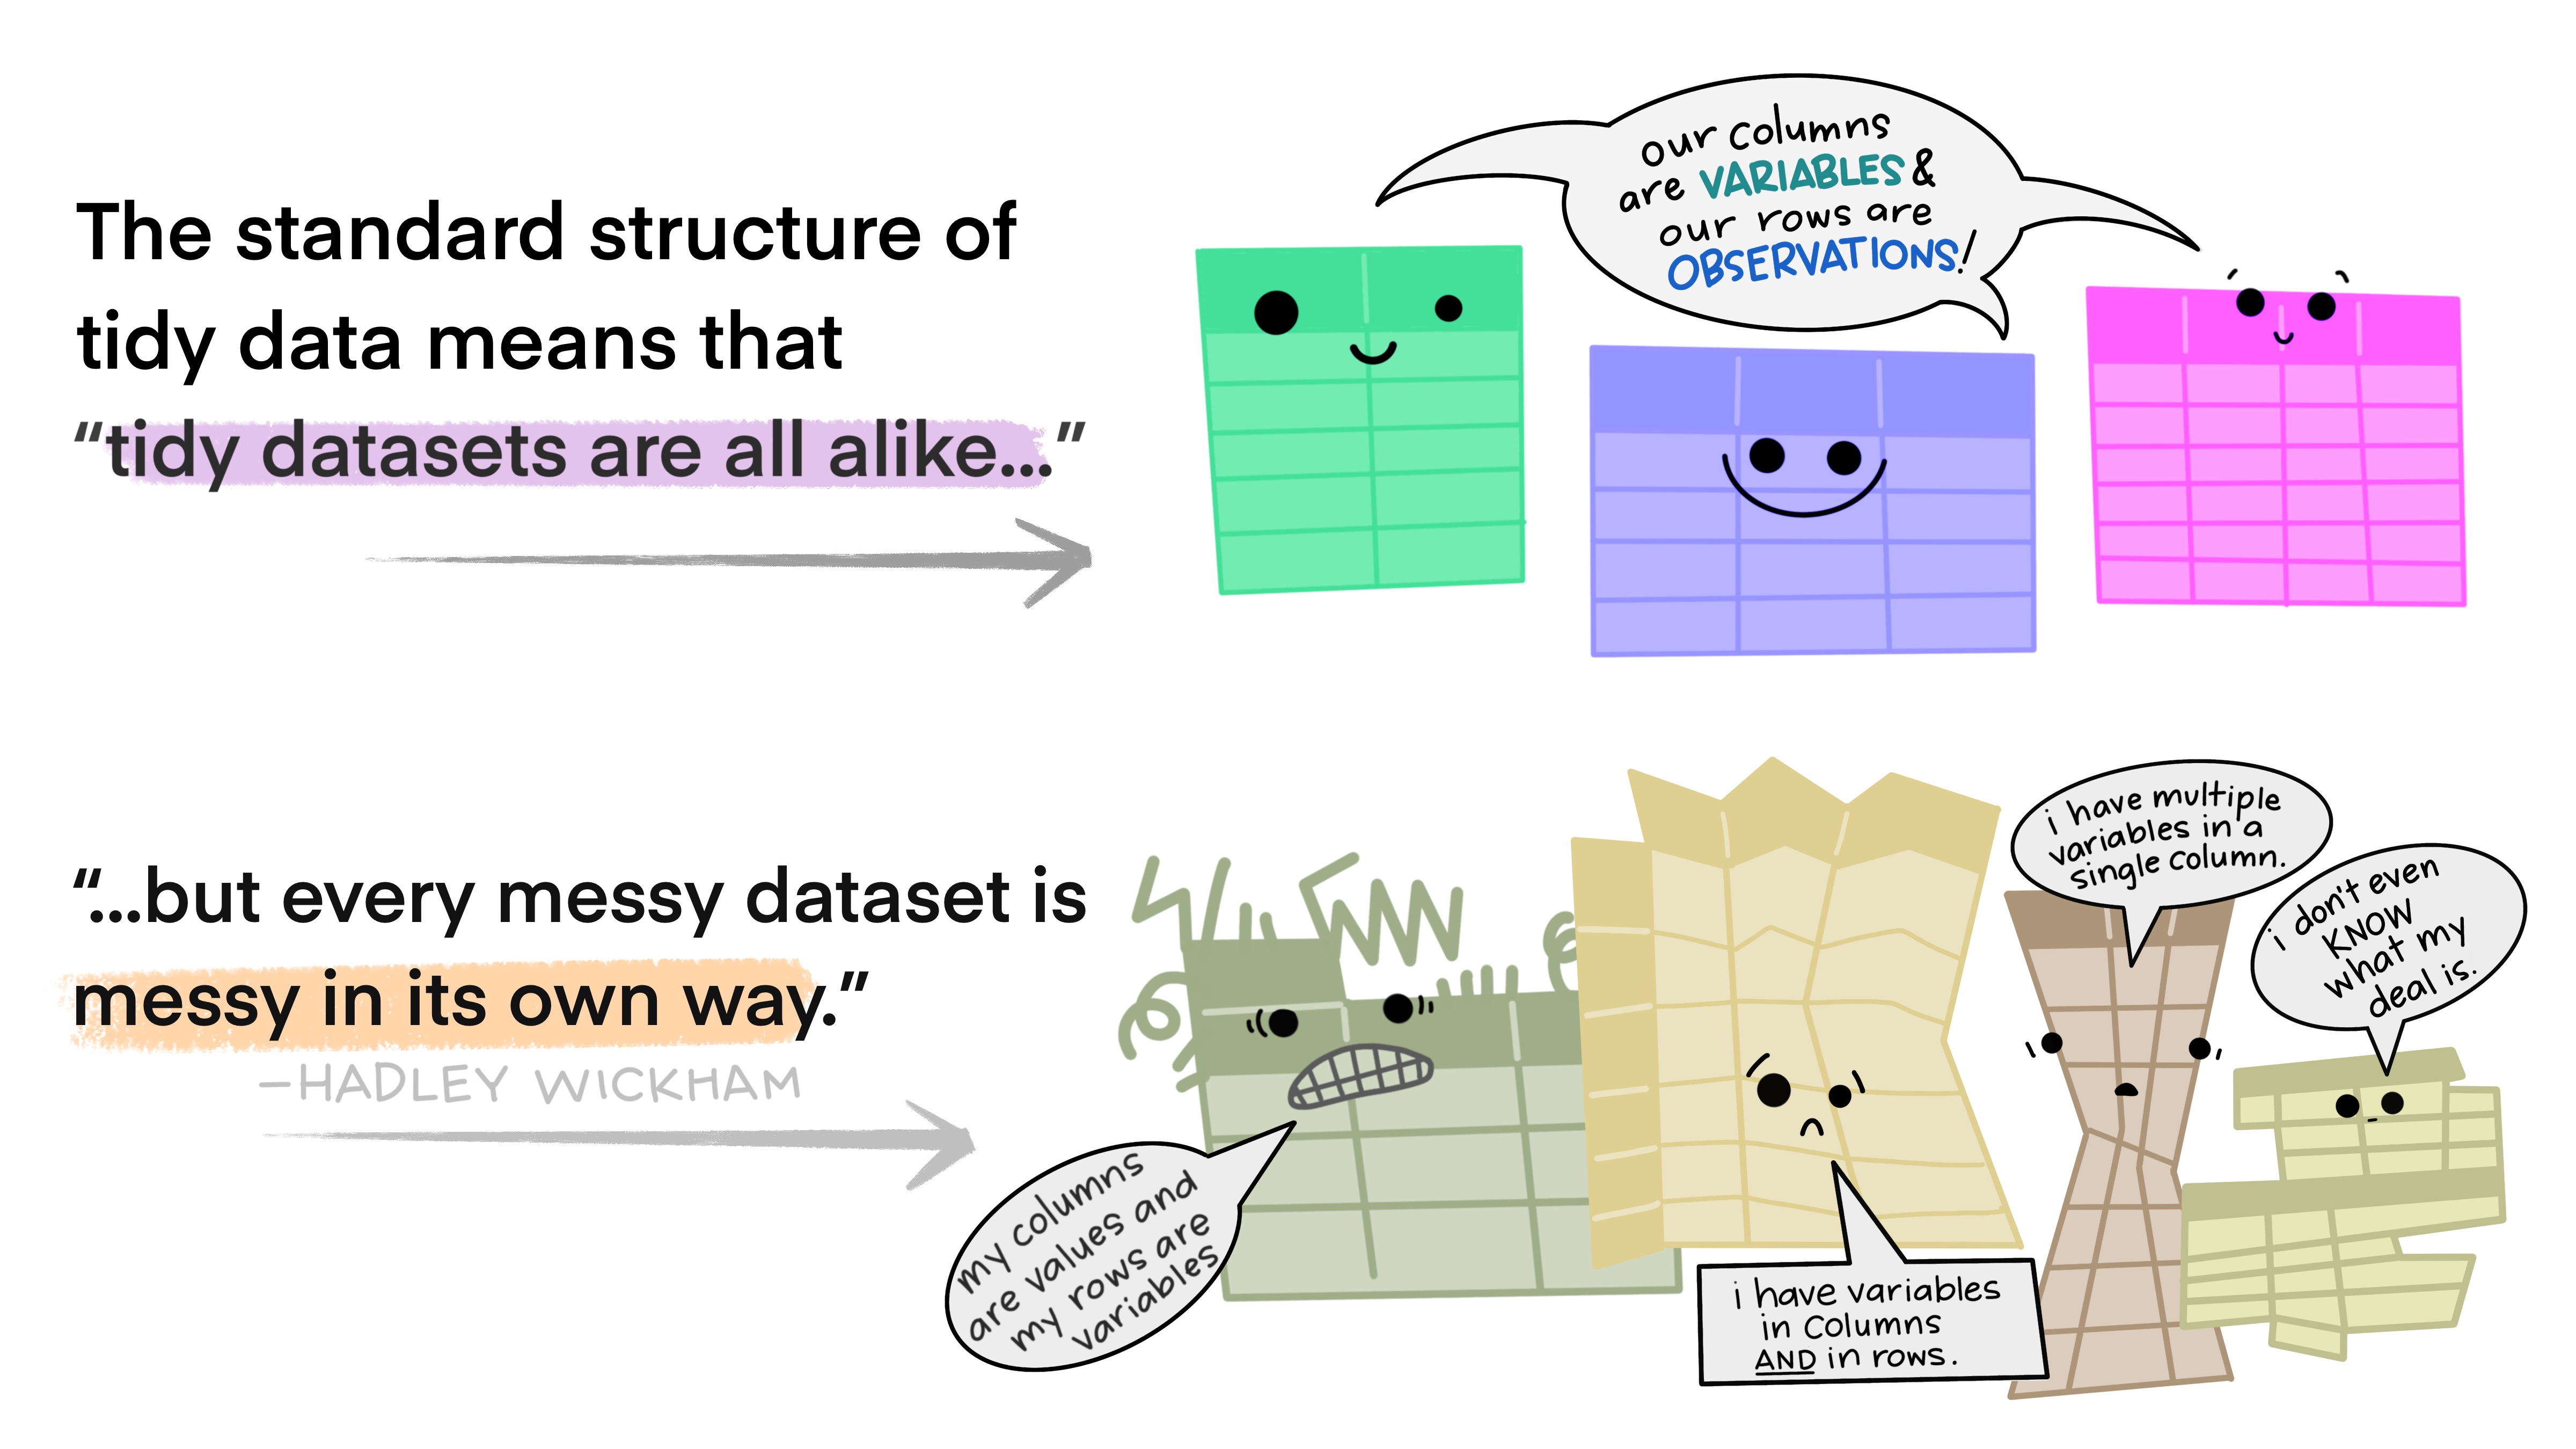
Tabular data: Why tidy data?

Tabular data: File formats
Comma-delimited (.csv)
- 👍 commonly used
- 👎 annoying when data itself contains commas
Tab-delimited (.tsv)
- 👍 no confusion when data contains commas or semicolons
- 👎 not very commonly used (at least not yet)
The data
⚠️ NOT REAL DATA ⚠️
The data have been modified from another dataset to mimic ONS Census data. Their sole purpose is to be used in training.
The data: variables
| variable | description |
|---|---|
| ID | a number to identify the participant |
| region | where in the UK the participant is located |
| interview_date | the date the interview took place |
| household_size | the number of members in the household |
| age | the ages of the people in the household |
| dwelling_type | the type of dwelling |
| bedrooms | the number of bedrooms in the dwelling |
| central_heating | whether the dwelling has central heating |
| cars | the number of cars the participant owns |
| community_establishment | the types of community establishment in the area |
| religion | the participant’s religion |
Importing data: Folders
- Double click on the R Project you created for the workshop to open RStudio.
- Check that the files you see in your
Filestab are the right ones (you should only see thescriptsfolder and the.Rprojfile) - Go to the console and type the following commands
Importing data: Download
Then we need to 1) download the data and 2) save it in the data_raw folder we just created it.
We can do both in one go in R by typing the following command in the console:
After you have run this command, open the data_raw folder and check that there is a file called census_data.csv.
Exercise 2.1
⏰ 10 mins
10:00
- Create a new tibble (
census_200) with the data in row 200 ofcensus_data - Create a new tibble (
census_last) from the last row, without typing out the row number- Check the output against
tail()
- Check the output against
- Create a new tibble (
census_middle) from the middle row of the dataset - Use the
-notation to reproduce the behavior ofhead(census_data)(show rows 1-6)
Exercise 2.1 solution
Factors
R has a special data class, called factor, to deal with categorical data. Factors:
- are stored as integers associated with labels, though they look like character vectors
- can be ordered (ordinal) or unordered (nominal)
- create a structured relation between the different
levels(values) of a categorical variable, such as days of the week or responses to a question in a survey
Exercise 2.2
⏰ 5 mins
05:00
- Change the columns
regionanddwelling_typein thecensus_datadata frame into a factor. - Using the functions you learned before, can you find out…
- How many different dwelling types there are in the
dwelling_typecolumn? - How many participants there are who are based in London?
Exercise 2.2 solution
Exercise 2.3
⏰ 5 mins
05:00
- Rename “no”, “yes”, and “unknown” to “No”, “Yes” and “Unknown” respectively.
- Recreate the barplot such that “Unknown” is last.
Exercise 2.3 solution

Dates
To avoid ambiguity, use the RFC3339 standard: YYYYMMDD (or YYYY-MM-DD).

Summary
- ✅ Read data into R.
- ✅ Understand and manipulate
tibbles. - ✅ Understand and manipulate
factors. - ✅ Alternate between date formats.